
Step 1 – Open the Product Report in Composer
- Log in to your Controls dashboard.
- Go to Composer.
- From the side menu, open the Analytics area (or the section where Product Reports live).
- Select the Product Report option.
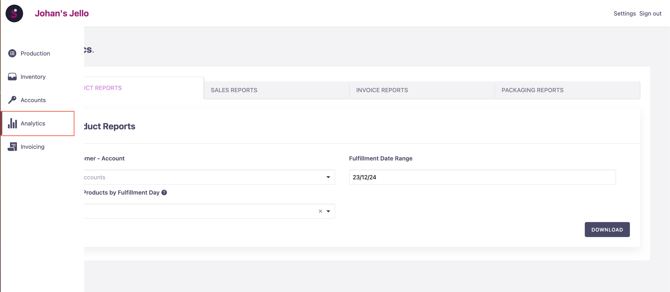
Step 2 – Choose which customer accounts to include
- Use the Customer Account dropdown:
- Select a specific account if you only want to see orders from that customer.
- Or leave it blank to include all customer accounts in one report.
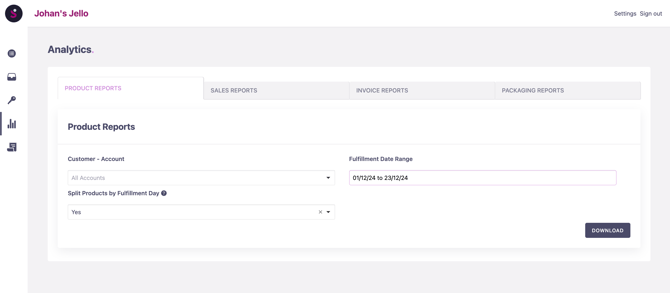
Step 3 – Set the fulfilment date range
- Use the date picker to choose the start and end fulfilment dates you want to analyse.
- The report will only include orders fulfilled within this period.
Step 4 – Decide how to group your data
- Look for the setting Split Products by Fulfilment Day:
- Yes (default): shows how many of each product were ordered per day (e.g. how many doughnuts on Monday, Tuesday, etc.).
- No: shows one total per product for the whole date range, without breaking it down by day.
Step 5 – Generate and download the report
- Once you’re happy with your selections, click Download.
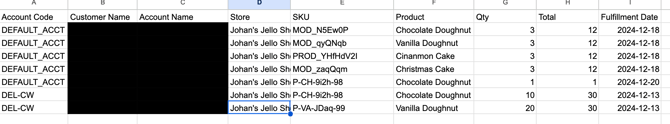
- The system will create a CSV file (spreadsheet) with your product data.
- Open it in Excel, Google Sheets, or similar to review and filter.
💡 Typical Uses
- Spot busy days for certain products (e.g. more doughnuts at weekends).
- Adjust stock and production to reduce waste.
- Identify best‑sellers and slower‑moving items.